Elasticsearch and Kibana on Docker: A Complete Local Setup Guide

Elasticsearch and Kibana on Docker: A Complete Guide
Elasticsearch and Kibana are powerful tools widely used for search, logging, and data visualization. Running them locally using Docker is the easiest way to experiment, develop, and test without complex installations.
In this guide, you’ll learn how to set up Elasticsearch and Kibana on Docker, connect them using a Docker network, and verify the setup.
What You’ll Learn
Running Elasticsearch on Docker
Running Kibana on Docker
Connecting Elasticsearch and Kibana
Verifying the setup using Kibana Dev Tools
Prerequisites
Docker installed on your system
Basic Docker knowledge
👉 If you’re new to Docker, check out my blog: Getting Started with Docker
What Is Elasticsearch?
Elasticsearch is a distributed, RESTful search and analytics engine commonly used for:
Full-text search
Log and metrics analysis
Observability and monitoring
It is fast, scalable, and widely used with the ELK Stack (Elasticsearch, Logstash, Kibana).
Step 1: Create a Docker Network
To allow Elasticsearch and Kibana to communicate, create a dedicated Docker network:
docker network create elastic
Step 2: Run Elasticsearch on Docker
Start an Elasticsearch container with the following command:
docker run \
  --name es01 \
  --net elastic \
  -p 9200:9200 \
  -it \
  -m 500MB \
  docker.elastic.co/elasticsearch/elasticsearch:8.10.4apache
Explanation of Flags
--nameada--netada-pcss-itapplescript-mdiff
Step 3: Capture Elasticsearch Credentials
Once Elasticsearch starts, note the following from the logs:
Elastic user password
Enrollment token
Certificate path
Export the Password
export ELASTIC_PASSWORD=<password-from-container-logs>routerosCopy the Certificate for Secure Communication
docker cp es01:/usr/share/elasticsearch/config/certs/http_ca.crt .awkThis certificate enables secure HTTPS communication with Elasticsearch.
Step 4: Test Elasticsearch Cluster Health
Run the following command to verify the cluster:
curl --cacert http_ca.crt \
  -u elastic:$ELASTIC_PASSWORD \
  https://localhost:9200/_cluster/healthstylus
If the response shows "status": "green" or "yellow", your cluster is running successfully ✅
What Is Kibana?
Kibana is a data visualization and exploration tool that works with Elasticsearch. It allows you to:
Visualize data
Build dashboards
Query Elasticsearch using Dev Tools
Monitor cluster health
Step 5: Run Kibana on Docker
Start the Kibana container:
docker run \
  --name kib01 \
  --net elastic \
  -p 5601:5601 \
  docker.elastic.co/kibana/kibana:8.10.4apache
Explanation
Runs Kibana on the same Docker network
- Exposes Kibana UI on port
5601yaml
Step 6: Connect Kibana to Elasticsearch
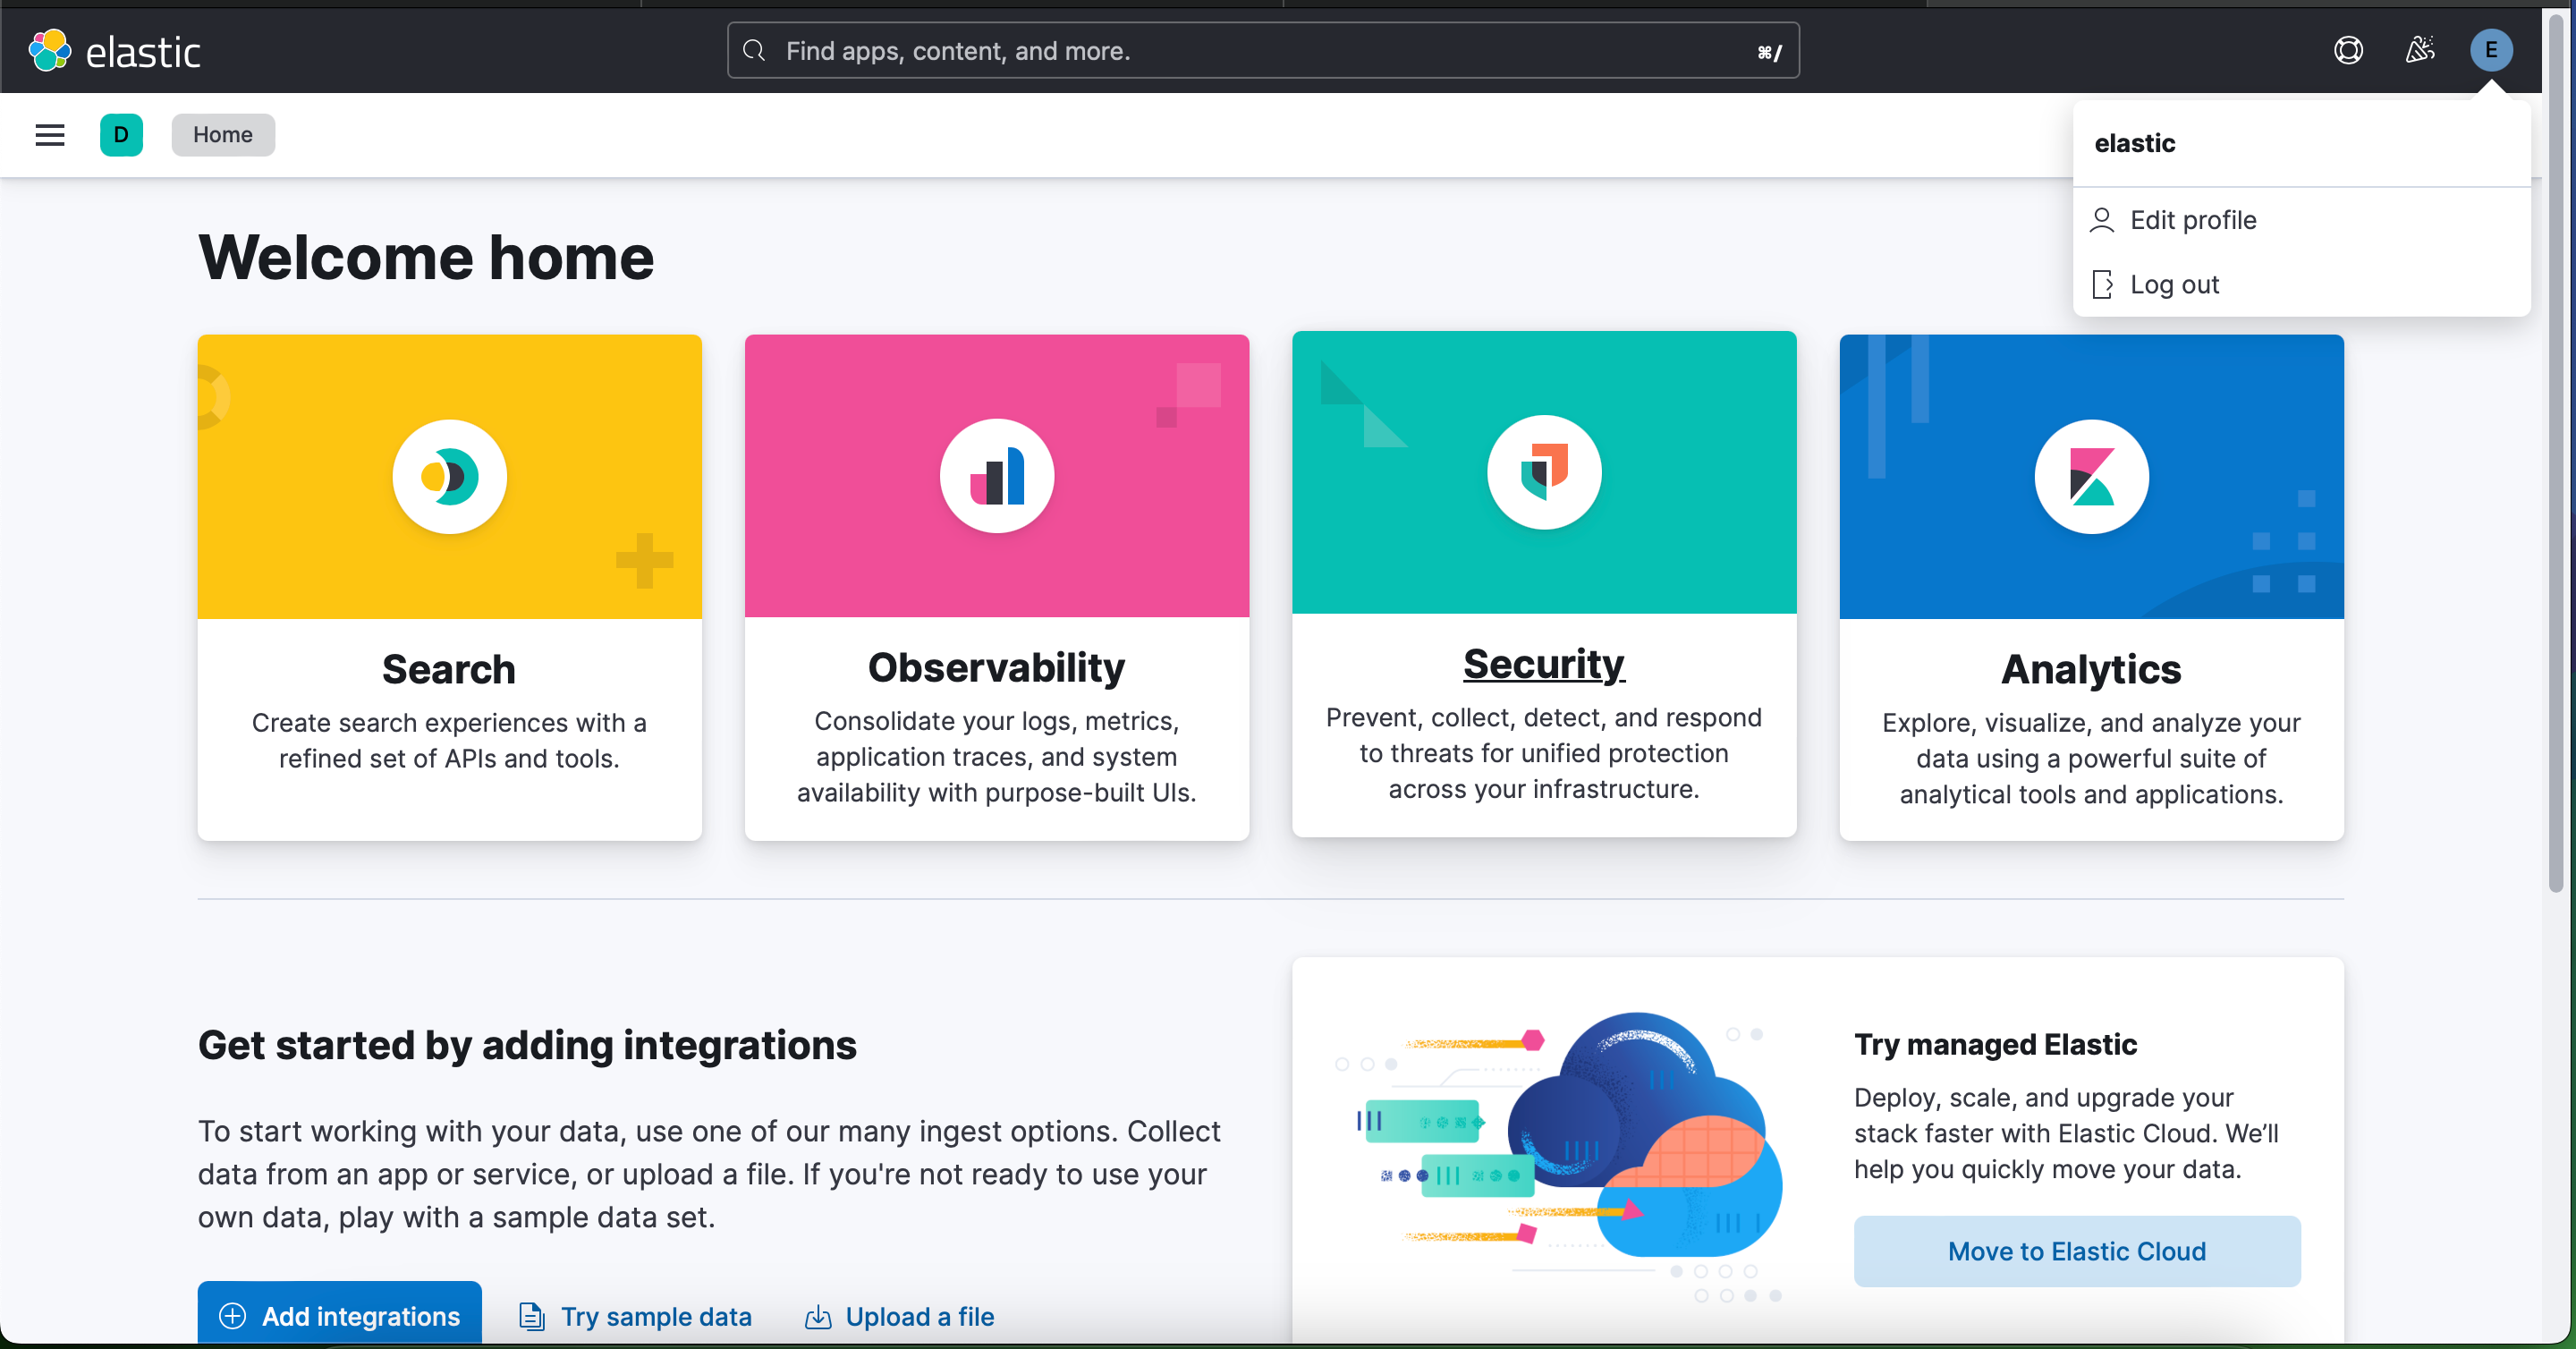
Open your browser and navigate to:
http://localhost:5601
Paste the Enrollment Token copied from Elasticsearch logs.
Log in using:
Username: elastic
Password: Value stored in ELASTIC_PASSWORD
🎉 Kibana is now connected to Elasticsearch.
Step 7: Verify Using Kibana Dev Tools
Open the hamburger menu in Kibana
Navigate to Management → Dev Tools
Run a test query:
GET _cluster/health
If you receive a valid response, the connection is successful ✅
Conclusion
In this guide, you learned how to:
Run Elasticsearch on Docker
Run Kibana on Docker
Securely connect both services
Verify the setup using Kibana Dev Tools
This setup is perfect for local development, testing, and learning Elasticsearch fundamentals.
Keep following the nasrulhasan.com for blogs & for more and cloud tutorials 🚀